This page contains a few examples sent by APL developers using LC.Charts.
All the functions and charts reproduced on this page have been provided by Mr. Brent Hildebrand and are published with his permission. They are also included in v2.2.0.0.
The first examples use the following utilities:
    ∇ z←l Step r;a
[1]   ⍝∇ z←l Step r -- Number series generator
[2]   ⍝∇ l ←→ range: 2-element vector (start, end)
[3]   ⍝∇ r ←→ step
[4]   ⍝∇ Example:
[5]   ⍝∇       1 10 Step 1
[6]   ⍝∇ 1 2 3 4 5 6 7 8 9 10
[7]   ⍝∇       3 0 Step .2
[8]   ⍝∇ 3 2.8 2.6 2.4 2.2 2 1.8 1.6 1.4 1.2 1 0.8 0.6 0.4 0.2 0
[9]   ⍝∇ Provided by Brent Hildebrand
[10]
[11]  z←(↑l)+(×a)×r×(-⎕io)+⍳1+⌊∣a←(--/l)÷r
    ∇

    ∇ z←Sin x
[1]   ⍝∇ z←Sin x -- Sinus function with degrees argument
[2]   ⍝∇ Provided by Brent Hildebrand
[3]
[4]   z←z←1○○x÷180
    ∇

    ∇ z←Cos x
[1]   ⍝∇ z←Cos x -- Cosinus function with degrees argument
[2]   ⍝∇ Provided by Brent Hildebrand
[3]
[4]   z←z←2○○x÷180
    ∇
The following APL function:
    ∇ Brent1;a;x;y
[1]   ⍝∇ Brent1 -- Function nicely provided by Brent Hildebrand
[2]
[3]   a←0 40000 Step 91
[4]   x←a×Cos a
[5]   y←a×Sin a
[6]   ⎕ucmd'chart x,[1.1]y'
    ∇
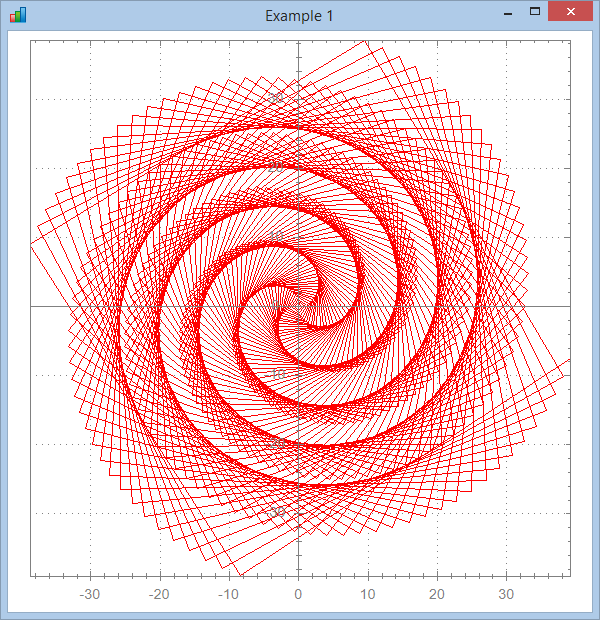
produces the following chart (note that the images in this page have been resized with: 'lccharts'⎕wi'*xWhere'200 600 620 600 to make the charts square):
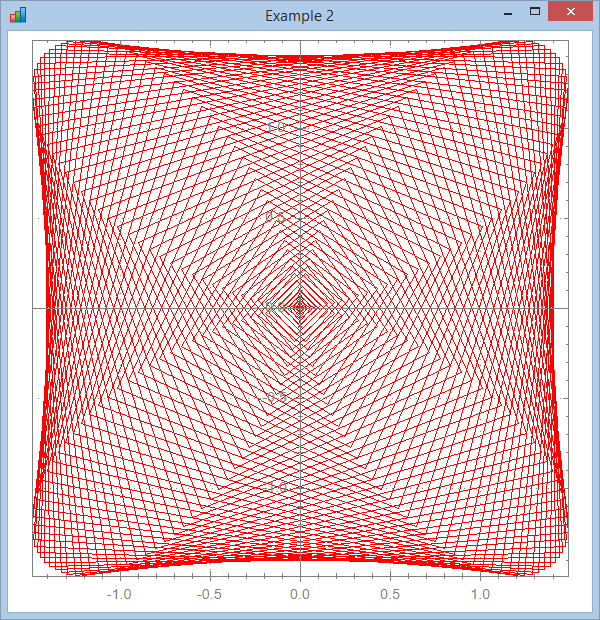
Here are other examples:
    ∇ Brent2;a;r;x;y
[1]   ⍝∇ Brent2 -- Function nicely provided by Brent Hildebrand
[2]
[3]   a←0 40000 Step 91
[4]   r←1-Cos 4×a
[5]   x←r×Cos a
[6]   y←r×Sin a
[7]   ⎕ucmd'chart x,[1.1]y'
    ∇
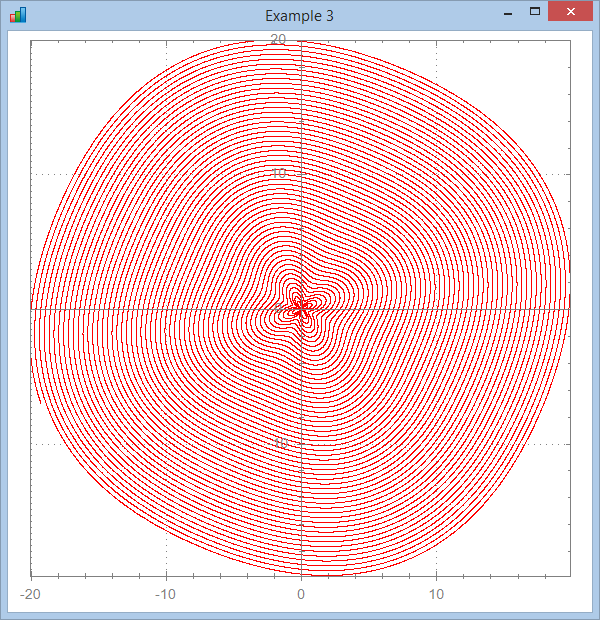
    ∇ Brent3;a;r;x;y
[1]   ⍝∇ Brent3 -- Function nicely provided by Brent Hildebrand
[2]
[3]   a←0 20000 Step.1
[4]   r←a+500×Sin 4×a
[5]   x←r×Cos a
[6]   y←r×Sin a
[7]   ⎕ucmd'chart x,[1.1]y'
    ∇
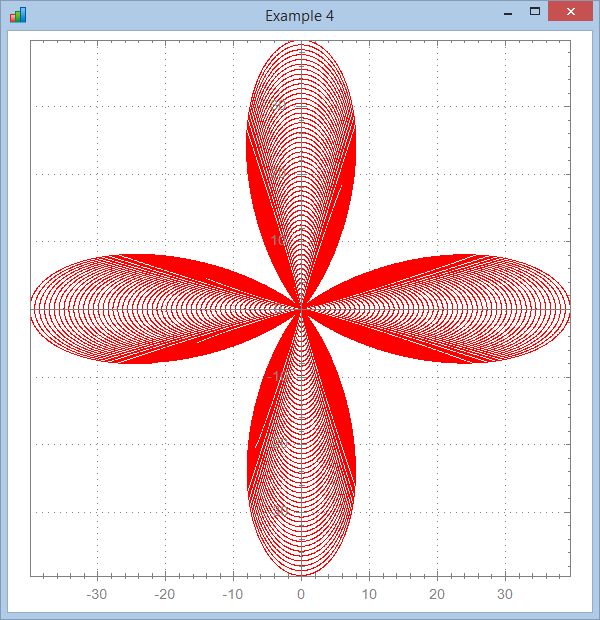
    ∇ Brent4;a;r;x;y
[1]   ⍝∇ Brent4 -- Function nicely provided by Brent Hildebrand
[2]
[3]   a←0 20000 Step .1
[4]   r←a+a×Cos 4×a
[5]   x←r×Cos a
[6]   y←r×Sin a
[7]   ⎕ucmd'chart x,[1.1]y'
    ∇
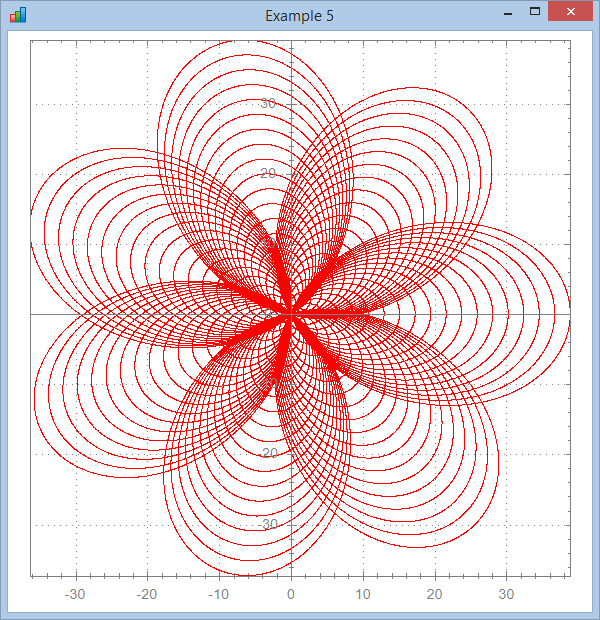
    ∇ Brent5;a;r;x;y
[1]   ⍝∇ Brent5 -- Function nicely provided by Brent Hildebrand
[2]
[3]   a←0 20000 Step .1
[4]   r←a+a×Cos (7÷3)×a
[5]   x←r×Cos a
[6]   y←r×Sin a
[7]   ⎕ucmd'chart x,[1.1]y'
    ∇
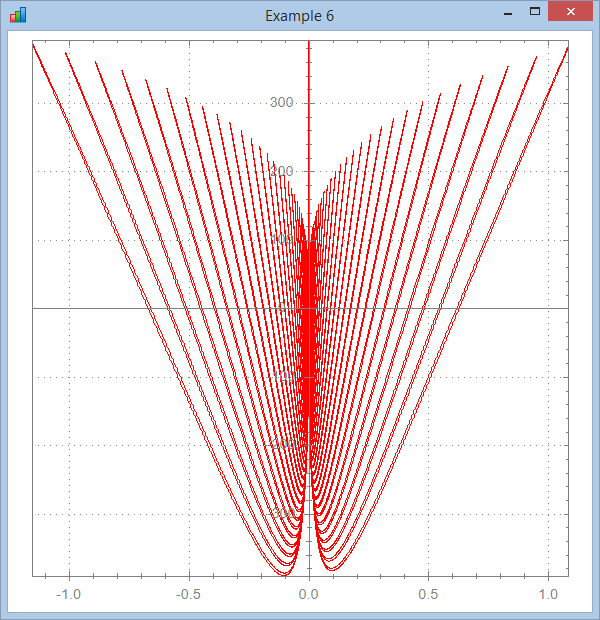
     ∇ Brent6;a;r;x;y
[1]   ⍝∇ Brent6 -- Function nicely provided by Brent Hildebrand
[2]
[3]    a←0 19800 Step .1
[4]   r←a+Cos 4×a
[5]   y←r×a×Cos 4×a
[6]   x←(r×Sin a)*7
[7]   ⎕ucmd'chart x,[1.1]y'
[8]   'lccharts'⎕wi'*xWhere'400 400 620 600
    ∇
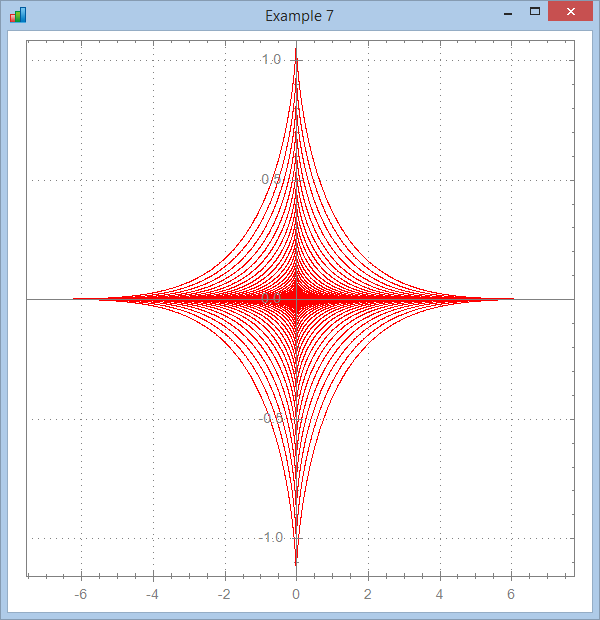
     ∇ Brent7;a;x;y
[1]   ⍝∇ Brent7 -- Function nicely provided by Brent Hildebrand
[2]
[3]   a←0 19800 Step .1
[4]   x←(a×Cos a)*3
[5]   y←(a×Sin a)*7
[6]   ⎕ucmd'chart x,[1.1]y'
    ∇
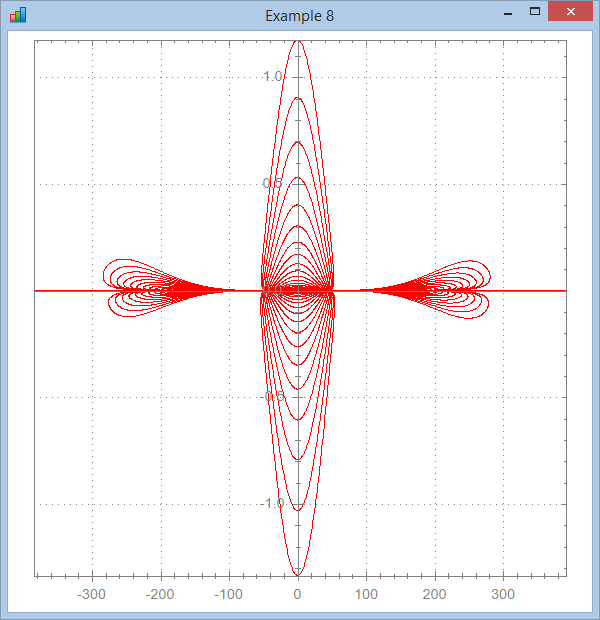
     ∇ Brent8;a;r;x;y
[1]   ⍝∇ Brent8 -- Function nicely provided by Brent Hildebrand
[2]
[3]   a←0 19800 Step .1
[4]   r←a×a×Cos 4×a
[5]   x←r×Cos a
[6]   y←(r×Sin a)*7
[7]   ⎕ucmd'chart x,[1.1]y'
    ∇
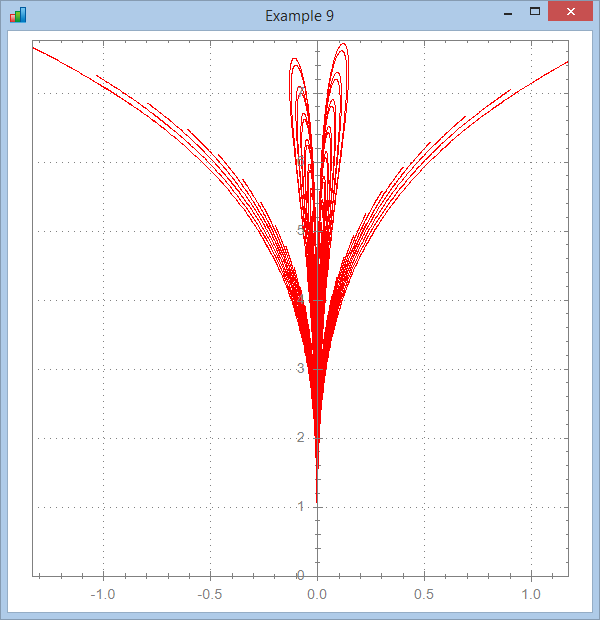
     ∇ Brent9;a;r;x;y
[1]   ⍝∇ Brent9 -- Function nicely provided by Brent Hildebrand
[2]
[3]   a←0 19800 Step .1
[4]   r←a×a×Cos 4×a
[5]   y←r×a×Cos 4×a
[6]   x←(r×Sin a)*7
[7]   ⎕ucmd'chart x,[1.1]y'
    ∇
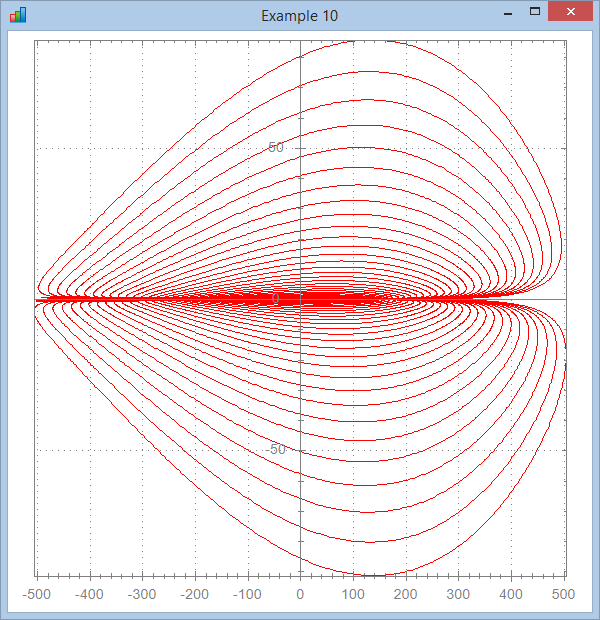
     ∇ Brent10;a;r;x;y
[1]   ⍝∇ Brent10 -- Function nicely provided by Brent Hildebrand
[2]
[3]   a←0 19800 Step .1
[4]   r←a+a×Sin 4×a
[5]   x←r×a×Cos 4×a
[6]   y←(r×Sin a)*7
[7]   ⎕ucmd'chart x,[1.1]y'
    ∇
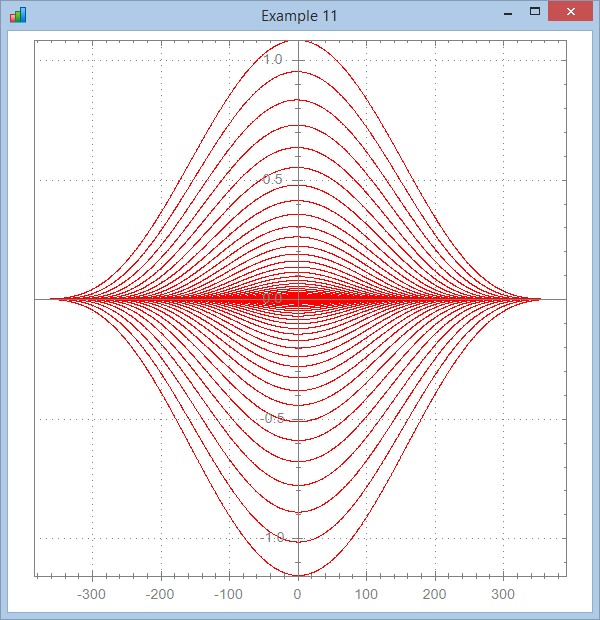
     ∇ Brent11;a;x;y
[1]   ⍝∇ Brent11 -- Function nicely provided by Brent Hildebrand
[2]
[3]   a←0 19800 Step .1
[4]   x←a×a×Cos a
[5]   y←(a×Sin a)*7
[6]   ⎕ucmd'chart x,[1.1]y'
    ∇
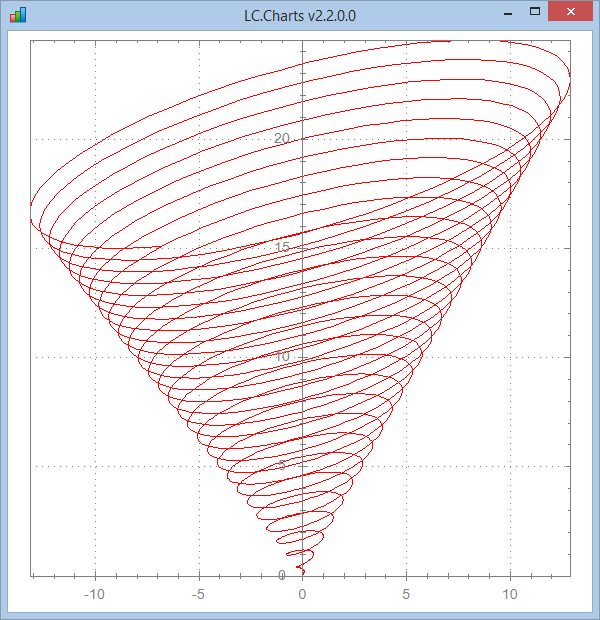
The last example is a 2D animated chart that gives the illusion of a 3D chart.
The Brent12_3d APL function that produces it is included in v2.2.0.0. Here is a fixed frame extracted from this animation.
Brent12_3d
