LC.Charts v2.83 Versions History
This page displays the LC.Charts versions history.
WARNING:
LC.Charts v2.83 requires APL+Win v15.0+
Important Note:
LC.Charts is delivered as a DLL and a User Command file called LCCHARTS.SF. You should set this file as your top level User Command file.
There is now also a workspace called LCCHARTS.W3 delivered in APL+Win v15.0 format.
It is also highly recommended to read the Getting Started with LC.Charts.doc documentation.
Version 2.83 (4apr17)
This new version includes the following enhancements:
- now uses the latest ZedGraph DLL (v5.1.7)
- now uses SharpPlot v2.63
- now takes in account the DPI to size the sample charts contained in the LCCHARTS.W3 workspace
- includes a new Dpi> property
- new OutsideColor property
- new AllowMouseRotateChart property
- new Close method (3D)
- new Dispose method
- the FillStyle property now accepts a 2-element vector including the RGB color and the style (string)
- there is a new FloatBar chart type
- added XMin, XMax, YMin and YMax properties to 3D charts (the supplied values must be real X and Y values)
- the product version number now has a X.XX format instead of X.X.X.X format
Version 2.50 (26aug15)
In this new version you can create the following new types of charts:
- all kinds of bar charts (horizontal, vertical, side by side, stacked, stacked 100%, ...)
- polar/radar charts
- time series/curves charts
- time series/curves with trend lines charts using polynomial fit (up to order 5)
All these charts are available through the LC.Charts.Chart3D object, even though they are indeed 2D charts.
The LCCHARTS.W3 workspace include the following demonstration APL functions:
- SampleBars
- SampleCurves
- SamplePolar
- SampleTrendCurves
The following new properties and methods have been added to the LC.Charts.Chart3D object:
- new bar chart type
- new curve chart type
- new polar chart type
- new xChartColors property
- new xValueTagStyle property
- new xValueTagStyles property
- new xBarChartStyle property
- new xBarChartStyles property
- new xValueFont property
- new xGap property
- new xGroupGap property
- new xLegend property
- new xValueTagFormat property
- new xXMax property
- new xXMin property
- new xYMax property
- new xYMin property
- new xXLabelFormat property
- new xYLabelFormat property
- new xZLabelFormat property
- new xHeadingStyle property
- new xHeadingStyles property
- new xPolarChartStyle property
- new xPolarChartStyles property
- new xFillStyle property
- new xFlexibility property
- new xMissingValue property
- new xLineGraphStyle property
- new xLineGraphStyles property
- new xLineStyle property
- new xLineStyles property
- new xFitOrder property
- new xSymbol property
- new xLineWidth property
- new xXAngle property
- new xScale property
The new v2.50 version includes the following bug fixes or enhancements:
- fix Out of Memory Exception occuring sometimes when rotating 3D charts with the mouse
- fix error sometimes occurring when rotating 3D charts with the mouse
- adapted LC.Charts to let 3D charts work ok in high DPIs or with Windows large fonts
- make the Esc key close the C# LC.Charts form
- make the Esc key close the C# LC.Charts form (2D)
Version 2.40 (3mar15)
This new version brings a number of properties and methods allowing to customize
some aspects of 3D charts.
Here is an example using some of these methods and properties:
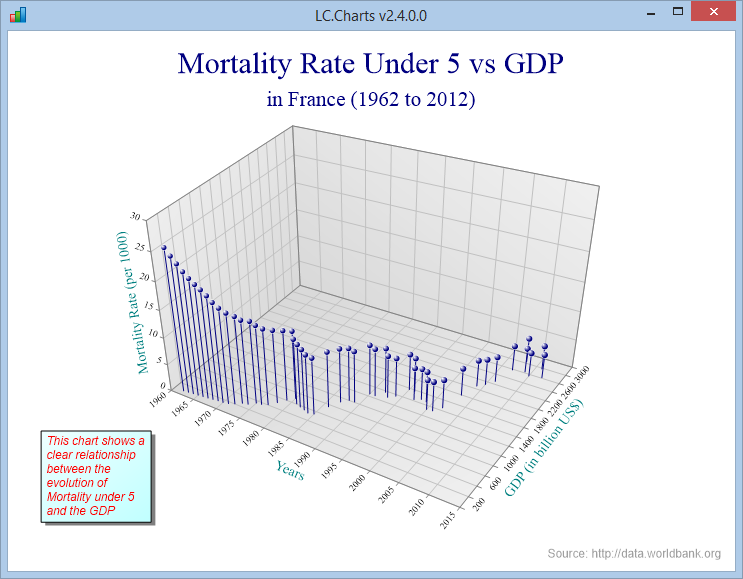
The main new 3D charts features are:
- ability to set the chart title and subtitle
- ability to set the X, Y and Z axis titles
- ability to change the X, Y and Z axis styles
- ability to change the X, Y and Z axis labels formats
- ability to change the styles for all of the 10 types of 3D charts
- ability to change 3D chart margins with a single method call
- ability to change the marker size (xSymbolSize) for scatter plots
- ability to add notes anywhere on the 3D chart
- ability to add a footnote to the 3D chart
- ability to change the 3D chart perspective
- a revised Getting Started with LC.Charts.doc guide with description of all the new features
The new properties and methods in v2.40 are:
- new xAltitudeStyle property
- new xAltitudeStyles property
- new xFillStyles property
- new xFitSurfaceStyle property
- new xFitSurfaceStyles property
- new xFlatTowerStyle property
- new xFlatTowerStyles property
- new xFootnoteStyles property
- new xNoteStyles property
- new xPerspective property
- new xPlanesStyle property
- new xPlanesStyles property
- new xResponseStyle property
- new xResponseStyles property
- new xScatterStyle property
- new xScatterStyles property
- new xSimpleSurfaceStyle property
- new xSimpleSurfaceStyles property
- new xSymbolSize property
- new xSubTitle property
- new xTiledSurfaceStyle property
- new xTiledSurfaceStyles property
- new xTowerStyle property
- new xTowerStyles property
- new xTrendSurfaceStyle property
- new xTrendSurfaceStyles property
- new xXAxisFormat property
- new xXAxisStyle property
- new xXAxisStyles property
- new xXAxisTitle property
- new xYAxisFormat property
- new xYAxisStyle property
- new xYAxisStyles property
- new xYAxisTitle property
- new xZAxisFormat property
- new xZAxisStyle property
- new xZAxisStyles property
- new xZAxisTitle property
- new XAddFootnote method
- new XAddNote method
- new XSetMargins method
Version 2.30 (31jan15)
This is a major new version including a large number of new properties to
allow you to fully customize 2D charts. Some improvements to 3D charts are
included as well. This version fulfills almost all the requests many of
you have sent me. Read details below the chart!
Here is an example using some of these new properties:
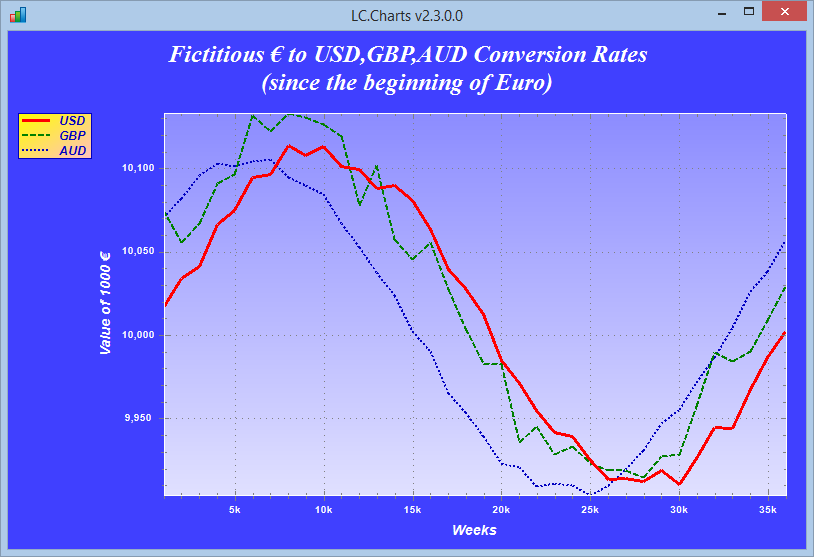
The main new 2D charts features are:
- ability to create overlay charts with a secondary Y-axis using a different scale
- ability to disable zooming and panning
- ability to fully customize the chart title font (name, size, style, color)
- ability to fully customize legends (position, font [name, size, style, color], fill color including gradient, border)
- ability to set the chart background color inside its axis (including gradient colors)
- ability to set the chart background color outside its axis (including gradient colors)
- ability to customize axis color
- ability to fully customize axis labels (automatic magnitude adjustments or not, format, font [name, size, style, color])
- ability to fully customize axis title fonts ([name, size, style, color])
- ability to now add multiline annotations anywhere on the chart
- ability to fully customize curves (line widths, line colors, line styles [dash, dot, solid, ...])
- direct support for accented letters and the € and £ symbols (no need to use AV2ANSI/ANSI2AV on the APL side)
- automatic update of the underlying xData property when you drag point on the chart
- new /adp option for ]chart to allow dragging points on the chart
- new /tr option for ]chart to display the chart topmost, at the top right of the screen
- a new TopRight APL utility
- a new Demo23 APL utility showing use of all the new 2D properties
- a new Overlay3 APL utility showing how to create overlay charts with a secondary axis
- a revised Getting Started with LC.Charts.doc guide with description of all the new features
- Bug Fix: fixed a problem with the xYAxisAtX property that would not work for negative values
Improvements to 3D charts are:
- ability to drag the mouse on the chart to manually rotate it
- ability to change the 3D chart form caption
- ability to display the real X and Y values in response plots (not just the point numbers)
- ability to set margins (in pixels, top, right, bottom, left)
- new /tr option for ]chart3d to display the chart topmost, at the top right of the screen
- Bug Fix: the 3D charts are now no longer offset when you have set your Windows fonts to medium or large
The new properties in v2.30 are:
- xAllowZoom
- xAxisColor
- xInsideColor, xOutsideColor
- xLegendBorder, xLegendFont, xLegendPosition, xLegendPositions
- xLineColor, xLineStyle, xLinesStyles, xLineWidth
- xMagAuto
- xTitleFont
- xUseY2Axis
- xXAxisFormat, xXAxisLabelsFont, xXAxisMagAuto, xXAxisTitleFont
- xYAxisFormat, xYAxisLabelsFont, xYAxisMagAuto, xYAxisTitleFont
- xY2AxisFormat, xY2AxisLabelsFont, xY2AxisMagAuto, xY2AxisTitleFont
- xY2AxisTitle, xY2MajorStep, xY2Max, xY2MinorStep, xY2Min
- XAddText
- xBottomMargin (3D)
- xCaption (3D)
- xLeftMargin (3D)
- xRightMargin (3D)
- xTopMargin (3D)
- xWhere (3D)
Version 2.20 (25jan15)
This version is experimental; its intention is for you to discover the 3D charts that
LC.Charts is going to support. For now there are only a few properties you can use
with these charts, but I guess you can already create real nice 3D charts using your
own data.
Version 2.20 includes 10 types of 3D charts:
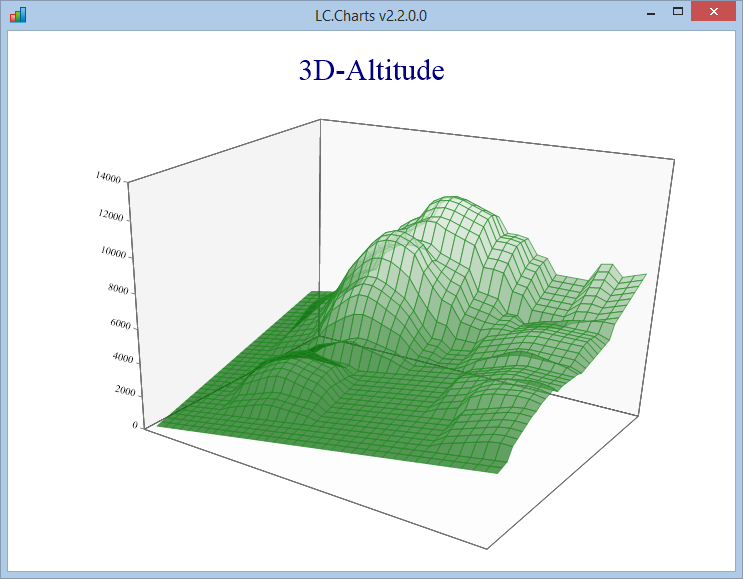
- altitude shading charts
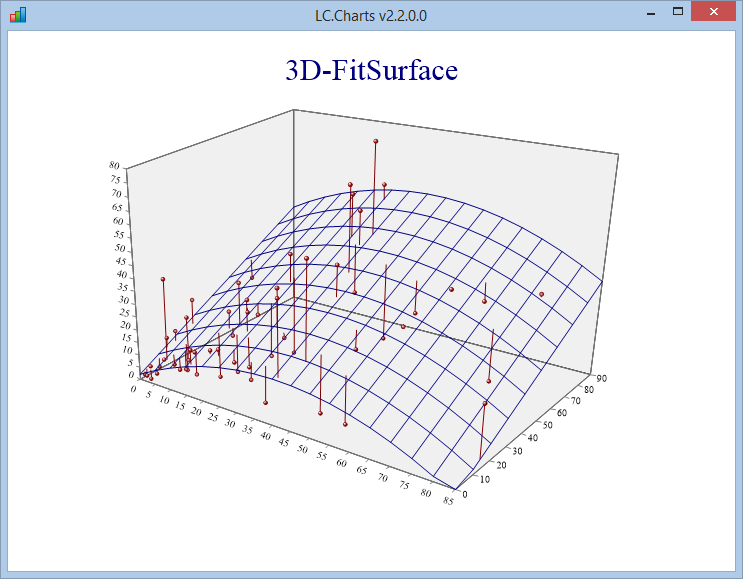
- fitsurface charts
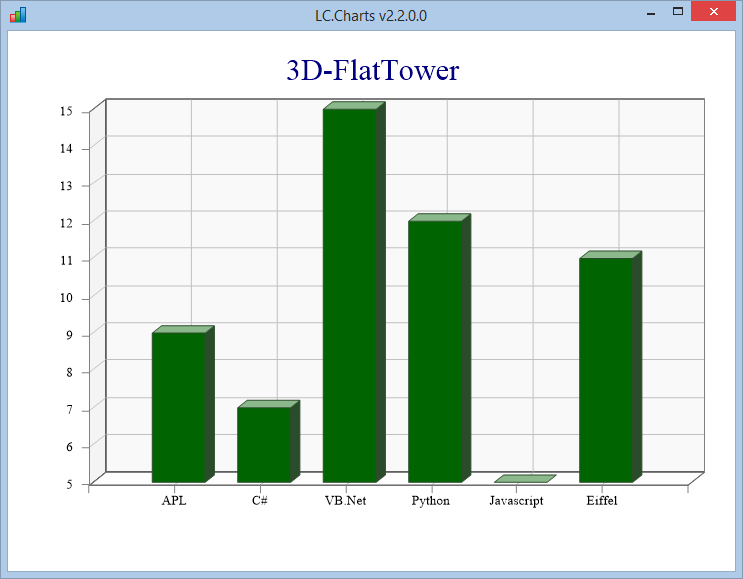
- flattower charts
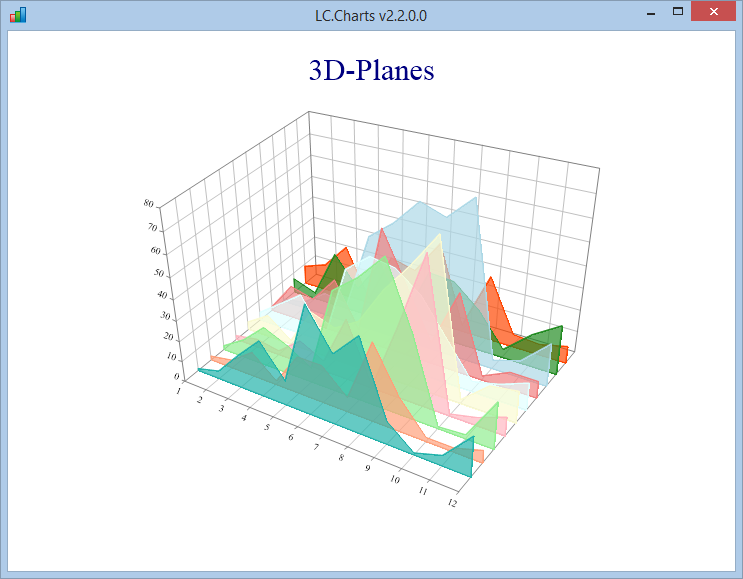
- planes charts
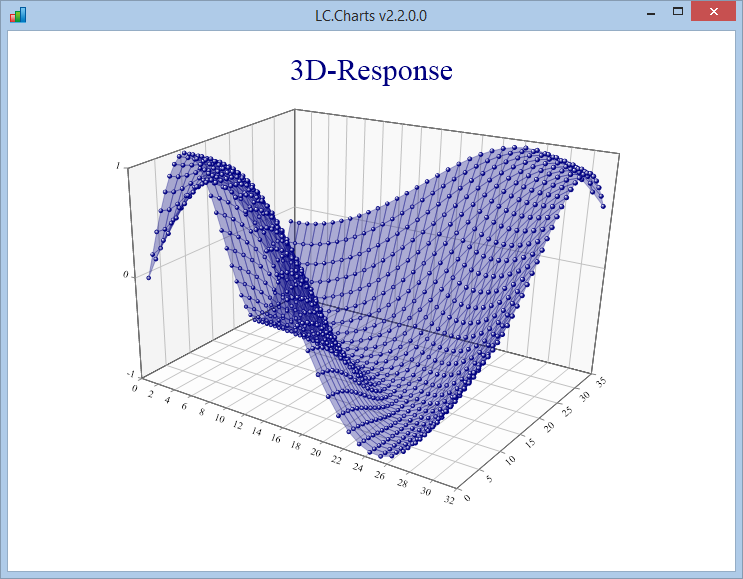
- response plot charts
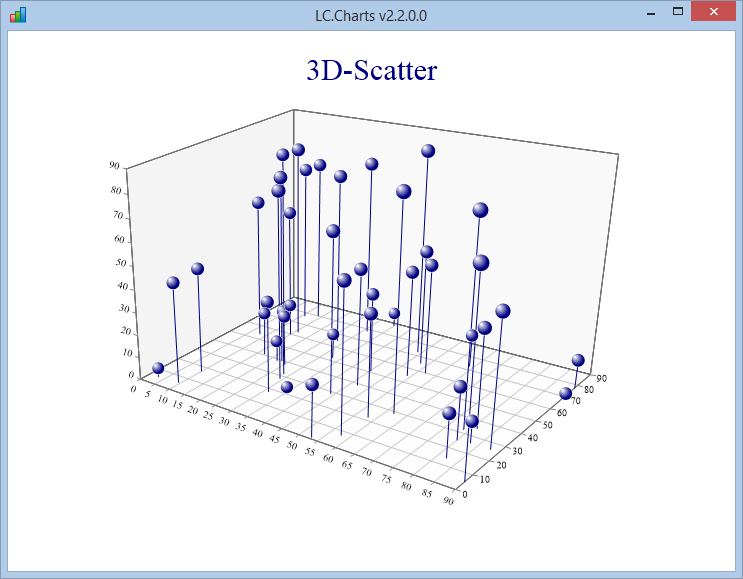
- scatter plot charts
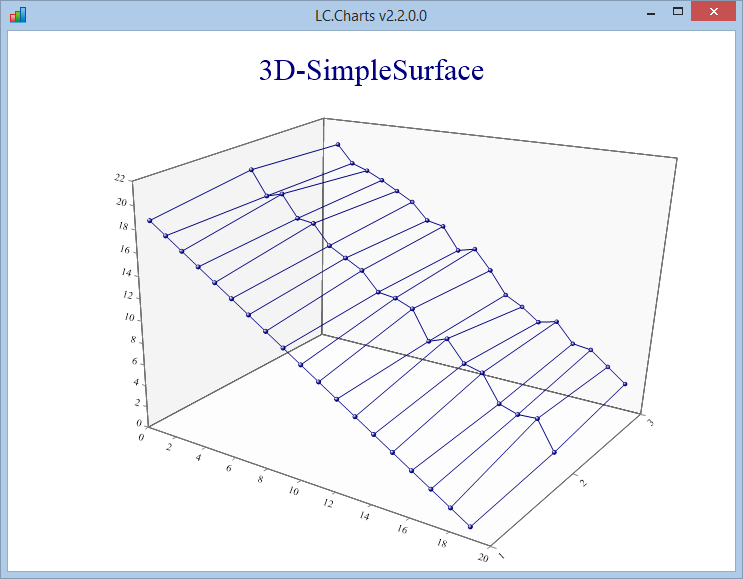
- simplesurface charts
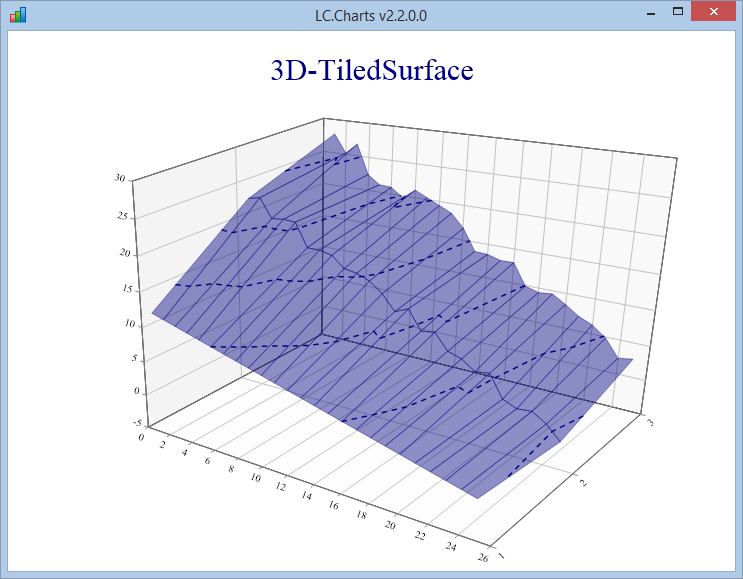
- tiledsurface charts
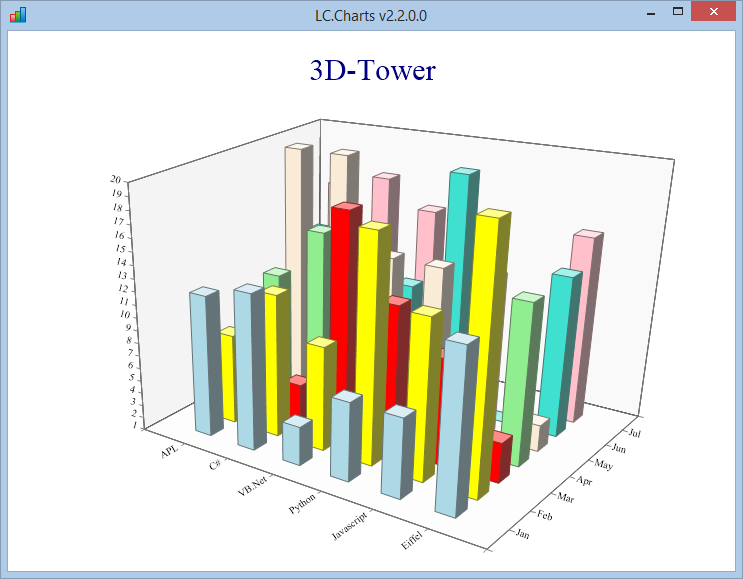
- tower charts
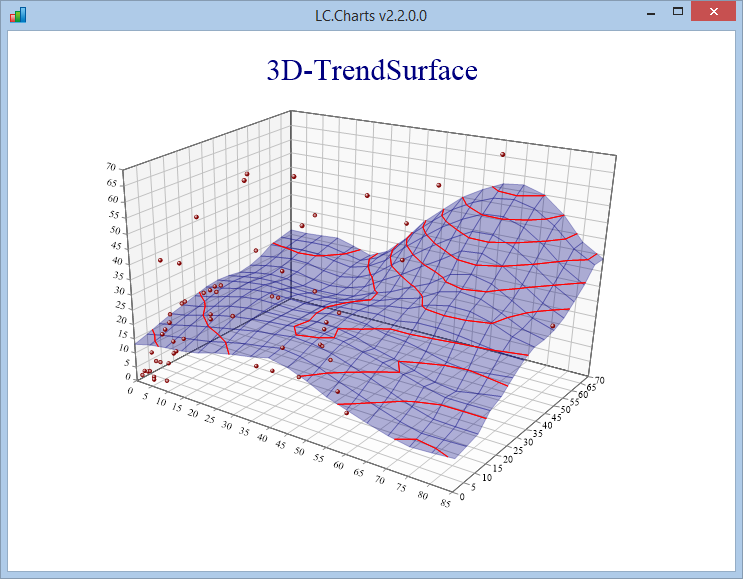
- trendsurface charts
Other enhancements are:
- a new LC.Charts.Chart3D ActiveX C# Form object
- a new LC.Charts.Chart3DUC ActiveX C# User Control object allowing to embed 3D charts in APL+Win forms
- a new ]chart3D User Command with a number of available options for an easy display of your data as 3D charts
- a new ]spinit User Command that lets you animate and spin any of the 3D chart you produce
- new APL functions to explore the 3D charts
- Sample3DAltitude
- Sample3DFitSurface
- Sample3DFlatTower
- Sample3DPlanes
- Sample3DResponse
- Sample3DScatter
- Sample3DSimpleSurface
- Sample3DTiledSurface
- Sample3DTower
- Sample3DTrendSurface
- a FormChartBasic3D APL function showing how to embed a 3D chart inside an APL+Win Form
- a Spin3D APL function allowing you to animate any 3D chart and make it rotate fluidly 360°
- a Terrain APL utility to let you create 3D terrains or landscapes with plains, hills and mountains
- a new EuroDollarRates chart that uses a Web Service to retrieve Euro to Dollar rates from the beginning of Euro till today
- a revised Getting Started with LC.Charts.doc document which includes all the new v2.2.0.0 features
- all the beautiful sample charts provided by Mr. Brent Hildebrand
Here is a sample of each of the new 3D charts:
Version 2.10 (18jan15)
This new version includes 6 major new features:
- the ability to overlay graphics on the same chart (see the documentation)
- the ability to embed charts into APL+Win Forms
- the ability to drag and drop curve points, thus interactively modifying curves
- the ability to drag and drop point labels, thus allowing to manually resolve point labels overlapping
- the possibility to localize your chart (context menu) in one of the following languages:
English, French, German, Spanish, Hungarian, Italian, Japanese, Portuguese, Russian, Slovak, Swedish, Chinese(China) and Chinese(Yaiwan)
- a chart tester and APL function generator that allows to interactively build a chart and then automatically generate the APL function that will recreate it!
Check the Getting Started with LC.Charts.doc document which has been updated with all LC.Charts v2.1.0.0 new features!
Also, more utility APL functions are delivered:
- Chart: displays a C# LC.Charts form topmost in the upper right corner of the screen (helpful to easily test LC.Charts properties)
- FormChartBasic: displays an APL Form with an embedded LC.Charts chart
- FormChart: an interactive LC.Charts Chart tester and function generator!
- Overlay1: a sample APL function showing how to overlay charts using ⎕ucmd
- Overlay2: a sample APL function showing how to overlay charts using ⎕wi
The enhancements in this new version are:
- new LC.Charts.ChartUC User Control that can be embedded in an APL+Win Form
- new xAllowDragPoint property specifying if user can darg and drop curve points
- new xFontsScaled property
- new XLocalizeTo allowing to localize LC.Charts to 13 different languages
- new xVisible property on the LC.Charts.ChartUC control
- new xBorder property on the LC.Charts.ChartUC control
- new xOverlay property allowing to overlay charts and graphs
- new Overlay1 APL function showing how to overlay charts using ]chart
- new Overlay2 APL function showing how to overlay charts using ⎕wi
- new Chart APL helper function to make it very easy to test LC.Charts porperties
- new FormChartBasic APL function showing how to embed a LC.Charts.ChartUC control in an APL+Win Form
- new FormChart APL function allowing to interactively build a chart and then save to an auto-generated APL function!
- new /reflect option added to the ]chart command to allow seeing changes immediately!
- the automatic xYMax default value has been increased by 5%
- Getting Started with LC.Charts.doc file updated with documentation about the new features
- detailed documentation added for all new properties
- detailed documentation added for all LC.Charts.ChartUC properties and for the XLocalizeTo method
- history Web page (this page) has been completed with the full LC.Charts history so far
- Bug Fix: Pie charts do no longer change their slices fill color as you redraw the chart!
- Bug Fix: LC.Charts now display axis correctly after changing type from pie to curve, bar or scatter
Version 2.00 (13jan15)
This new version includes:
- full detailed documentation of all LC.Charts properties
- new 30-page Getting Started with LC.Charts.doc document
- new xCurveFill property and /cf= option allowing to paint the area below curves
- new xHandle property returning the LC.Charts window handle
- new xXMinorStep property allowing to get, set the X-Axis minor tickmark step
- new xYMinorStep property allowing to get, set the Y-Axis minor tickmark step
- new xYAxisAtX property allowing to indicate where the Y-Axis should cross the X-Axis
- new XClose method allowing to programmatically close the LC.Charts window
- each Property now has an associated XPropertyDoc method returning the property documentation (example: XSymbolDoc)
- new ]chart /chartaxistypes option
- new ]chart /chartcolors option
- new ]chart /chartsymbols option
- new ]chart /charttypes option
- new ]chart /cf= option
- new ]chart /properties option listing all LC.Charts properties
- new ]chart /methods option listing all LC.Charts methods
- new ]chart /version option returning the LC.Charts.dll version number
- new ]chart /doc= option allowing to get detailed documentation about any LC.Charts property
- new ]chart /xminstep= option has been added
- new ]chart /yminstep= option has been added
- the ]chart? documentation has been updated
- the xLegend property has been extended to charts where xData is a vector
- Bug Fix: the handling of Legends has been improved
- Bug Fix: all properties are now sensible to the xReflect property setting
- Bug Fix: setting the xSymbolFill property was resetting xSymbolSize to the default size
- Bug Fix: xMajorStep was not always correctly working
Version 1.71 (9jan15)
- Adapted APL functions to be )evlevel neutral (i.e. work in )evlevel 1 and in )evlevel 2)
- Removed some recent APL+Win new features which prevented LC.Charts to work in older versions of APL
- Tested LC.Charts to work ok in all versions of APL+Win starting at v6.4 (may also work in even older versions)
Version 1.70 (6jan15)
- /legend= option added to ]chart
- an LC.Charts Form icon has been added
- all ]chart options that accept a value may now have the value prefixed by ⍎ to allow using APL variables for the options
- new XAngle property or /xa= option for X-Axis labels angle
- new YAngle property or /ya= option for Y-Axis labels angle
- new XAxisType property or /xscale= option for X-Axis type
- new xChartColors property or /chartcolors option to get/set the 22 chart colors
- new xChartSymbols property or /chartsymbols option to get the available symbols
- new xChartAxisTypes property or /chartaxistypes option to get the available axis types
- new xChartTypes property or /charttypes option to get the available chart types
- the xSymbols property has been renamed xChartSymbols
- new XMajorStep property to get/set the step between major X-axis ticmarcks
- new YMajorStep property to get/set the step between major Y-axis ticmarcks
- new XMinorStep property to get/set the step between minor X-axis ticmarcks
- new YMinorStep property to get/set the step between minor Y-axis ticmarcks
- more charts examples and animations added to the CLCHARTS User Command file
Version 1.6.0.0 (4jan15)
- The xData property has been extended to now allow to display point text labels (not just point values)
- Bug fix: Point labels are now correctly positioned when zooming
Version 1.0.0.0 (1jan15)
LC.Charts is a C# ActiveX DLL desgined to make it very easy to deisplay APL variables in charts
LC.Charts v1.0.0.0 includes:
- the LC.Charts.dll
- an APL User Command file LCCHARTS.SF with ]chart User Command
- ability to draw curves
- a basic set of properties to customize the chart
LC.Charts Project Started (28dec14)